

Author: @atilayberber
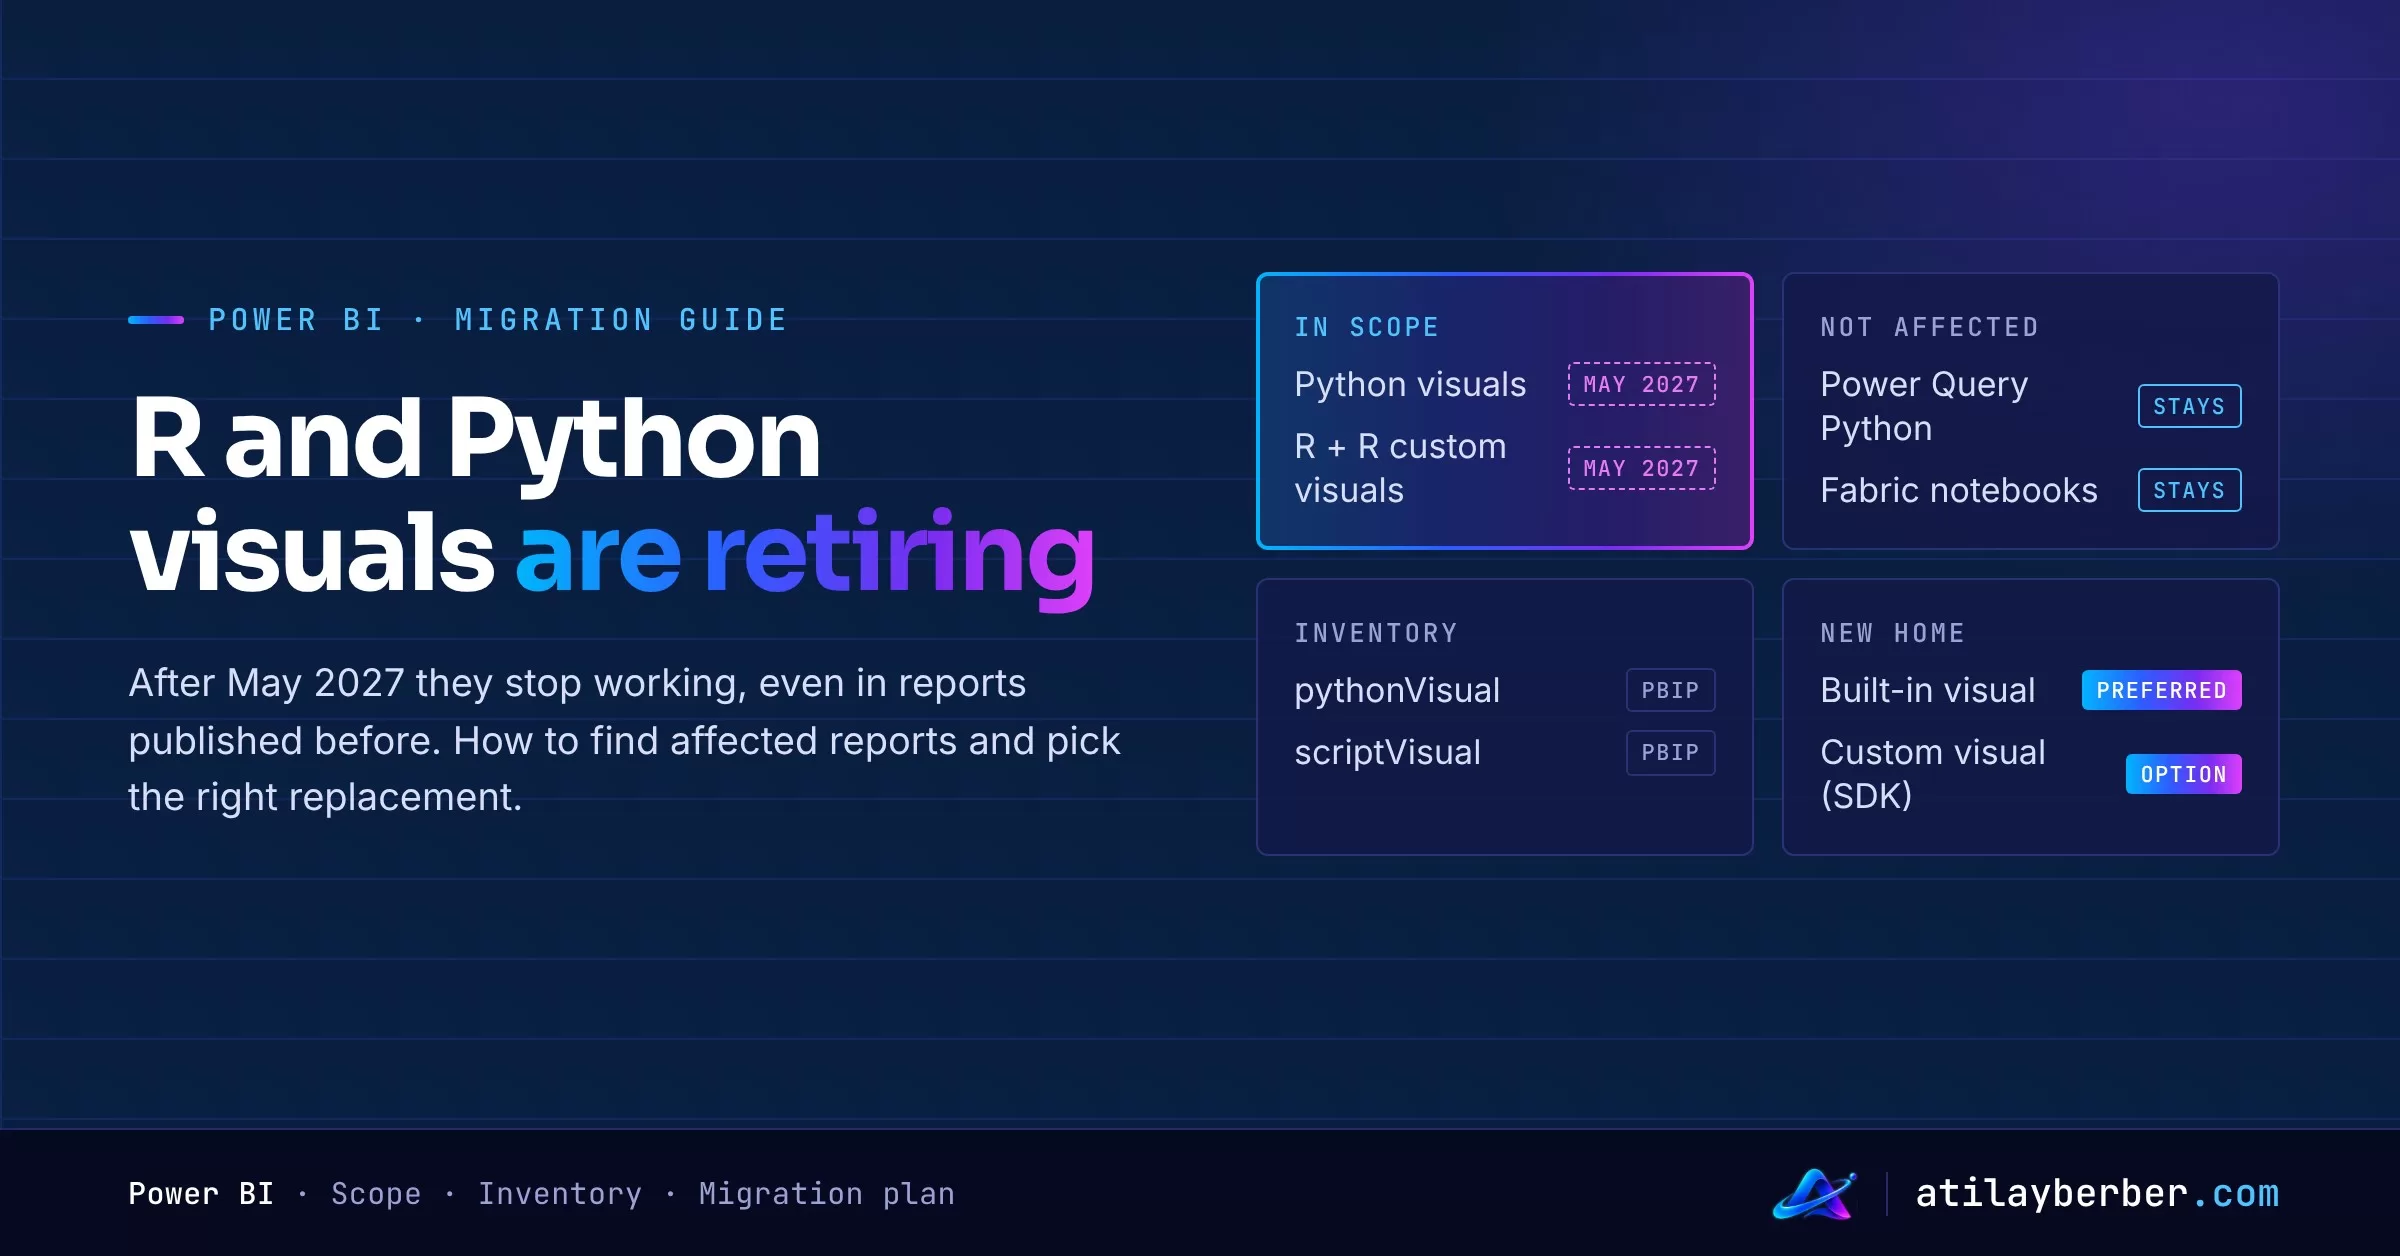
On November 9, 2026, Microsoft announced that the built-in R and Python visuals in Power BI will retire in May 2027. This isn’t a “you won’t be able to add them anymore” kind of notice. At retirement, every R and Python visual in the Power BI service, including those in reports published before that date, stops working.
This post covers what’s affected, what isn’t, how to find the reports that use these visuals, and where each type of visual should go next. At the end there’s a six-month migration plan I’d suggest.
In short
| Topic | Status |
|---|---|
| Python visuals | Retire in May 2027 |
| R visuals and R-powered custom visuals | Retire in May 2027 |
| Existing reports in the service | These visuals stop working at retirement |
| Python scripts in Power Query | Not affected |
| Automatic conversion | None; each visual has to be replaced |
| Suggested destinations | Built-in or custom visuals, Fabric notebooks, Fabric Apps |
What exactly is changing?
According to the official announcement and the Python visuals page on Microsoft Learn:
- The retirement applies only to R and Python visuals in interactive Power BI reports.
- At retirement, all R and Python visuals in the Power BI service stop working, including those published earlier.
- R-powered custom visuals also stop working at retirement.
- Older versions of Power BI Desktop keep running these visuals locally, using the R and Python installed on your machine. Future Desktop versions remove them, so you won’t be able to add them to reports.
- The announcement is blunt about migration: no migration within your report will recreate your exact R or Python visual. You have to replace it with a different visualization before retirement.
The announcement gives a single date: May 2027. It doesn’t name a day, and it doesn’t say how Power BI Report Server or embedded scenarios are handled. If you rely on those, keep an eye on the official pages rather than assuming they behave the same.
What isn’t affected?
This is the part most likely to cause confusion: Python scripts used in Power Query to populate tables are not affected. If you use a “Run Python script” step for data prep, this announcement doesn’t directly touch you.
Python and R work in Fabric notebooks isn’t part of this retirement either. In fact, Microsoft lists notebooks as one of the alternatives outside the report.
Step 1: Find the affected reports
The only tooling tip in the announcement is this: if your reports are in PBIP format and in Git-integrated workspaces, search the report definitions for the visual type:
- Python visuals:
pythonVisual - R visuals:
scriptVisual
If your PBIP folders live in a Git repo, the short Python script below lists how many Python and R visuals each report contains. It does a plain-text search so it works on both the newer PBIR files (visual.json) and the older report.json:
import pathlib

TYPES = {"pythonVisual": "Python", "scriptVisual": "R"}
root = pathlib.Path(".")  # root of the Git repo

counts = {}
for f in root.rglob("*.json"):
    text = f.read_text(encoding="utf-8", errors="ignore")
    for key, lang in TYPES.items():
        n = text.count(key)
        if n:
            report = next((p.name for p in f.parents if p.name.endswith(".Report")), str(f))
            counts[(report, lang)] = counts.get((report, lang), 0) + n

for (report, lang), n in sorted(counts.items()):
    print(f"{report:50} {lang:7} {n}")
Two caveats:
- PBIX files are binary (zipped), so this search won’t see inside them. Save your important reports as PBIP and run the same search.
- R-powered custom visuals don’t show up as
scriptVisual; they come with their own custom visual IDs. Check each report’s list of custom visuals separately.
If your reports aren’t in Git, at least run a quick survey with the owners of your critical reports: “Does your report use a Python or R visual?” The announcement also asks people who view an affected report but don’t own it to contact the report owner.
Step 2: Pick the right destination for each visual
Microsoft’s options fall into two groups: stay in the report, or move out of it. Here’s how I’d map the Python/R visual patterns I see most often:
| Today’s Python/R visual | Where I’d move it |
|---|---|
| Bar, line or scatter chart drawn in Python just for styling | A built-in Power BI visual |
| Statistical charts such as box plots, histograms, heatmaps | Built-in visuals and certified custom visuals first; the custom visuals SDK if nothing fits |
| A visual that shows model output (clusters, forecasts, scores) | Move the calculation to a Fabric notebook, write results to a table, show them with a built-in visual |
| A custom analysis that can’t be rebuilt in a report | A Fabric notebook or Fabric Apps |
Staying in the report
- Built-in visuals: This should be your first stop. Most charts drawn in Python can be covered by a built-in visual and some formatting. And built-in visuals are interactive: cross-filtering, tooltips and drill-down all work.
- Custom visuals: Microsoft suggests using an existing custom visual, or building your own with AI coding tools and the Power BI custom visuals SDK. If you build your own, remember you’re also signing up to maintain it.
- Roadmap: The announcement mentions planned HTML and Vega core visuals for more flexible report visualizations. They’re on the roadmap for now, so don’t hang your plan on them today, but they may be a good target for some custom visuals once they ship.
Moving out of the report
- Fabric notebooks: Run the Python or R analysis in a notebook. The announcement is clear that scripts may need changes for supported languages, libraries and data access. My advice: use the notebook to produce results, not to draw pictures. Write the output to a lakehouse table and show it in the report with a built-in visual, so it stays interactive.
- Fabric Apps: Recommended for visualizations that can’t be recreated in a Power BI report. I’ve discussed where Fabric Apps sit relative to reports in Will Fabric Apps replace Power BI reports?
Both notebooks and Fabric Apps can sit next to your reports inside Organizational Apps, so users keep a single entry point.
Step 3: Keep the scripts and their dependencies
The announcement recommends preserving scripts and dependencies. Before you replace anything, commit each Python/R visual’s script, the packages it uses and their versions to a repo. For analyses you’ll move to notebooks, that’s half the work done.
A six-month plan I’d suggest
May 2027 is roughly six months away. Here’s how I’d use them:
- November–December 2026: Inventory. PBIP + Git search, a quick survey of report owners, save scripts and package lists.
- January 2027: Prioritize. Heavily used and executive-facing reports go first. Pick a destination for each visual from the table above.
- February–March 2027: Replace. Swaps to built-in visuals are quick; analyses moving to notebooks take the longest.
- April 2027: Test and communicate. Test the new visuals with users and announce the change.
- Before May 2027: Remove the old visuals from the service. Make sure you’re waiting for the date, not the other way around.
When should you worry?
- No Python or R visuals in your reports: nothing to do. Your Power Query Python scripts aren’t affected either.
- A handful of visuals: most likely an afternoon of work with built-in visuals.
- Dozens of Python/R visuals showing model output in critical reports: this isn’t a visual swap, it’s a small architecture change. Start now on separating calculation (notebook) from presentation (report).
My take
Running a model inside a visual was always a fragile pattern: limited interactivity, unpredictable performance, and maintenance tied to one person. This retirement pushes many teams into a split they should have made anyway: compute in the notebook, present in the report. The hard part isn’t technical; it’s knowing what lives where in your reports. So the first job is the inventory.
Sources
- Announcing the retirement of R and Python visuals in Power BI (Power BI Updates Blog, November 9, 2026)
- Microsoft Learn: Create Power BI visuals with Python
- Microsoft Learn: Power BI Desktop projects (PBIP)
- Microsoft Learn: Develop Power BI custom visuals
- Microsoft Learn: How to use Microsoft Fabric notebooks
- Power BI roadmap
How many Python or R visuals are in your reports? Tell me on LinkedIn, and I may cover the most common scenarios in a follow-up post.