

Author: @atilayberber
Right after September’s big FabCon release, Microsoft published the Power BI October 2026 feature summary. The list is short this month, but there’s a lot in it: the report-authoring agent now works with custom visuals, Gantt is a core visual, and slicers and charts get settings people have been asking for. On the semantic model side there’s a quiet change that matters to anyone who manages capacity.
In this post I go through every October 2026 item: what it does, whether it’s GA or preview, and where it actually helps. It’s also the first post in the new Monthly Update Notes series on this site. Every month, when the Power BI and Fabric updates land, I’ll cover them here in separate posts.
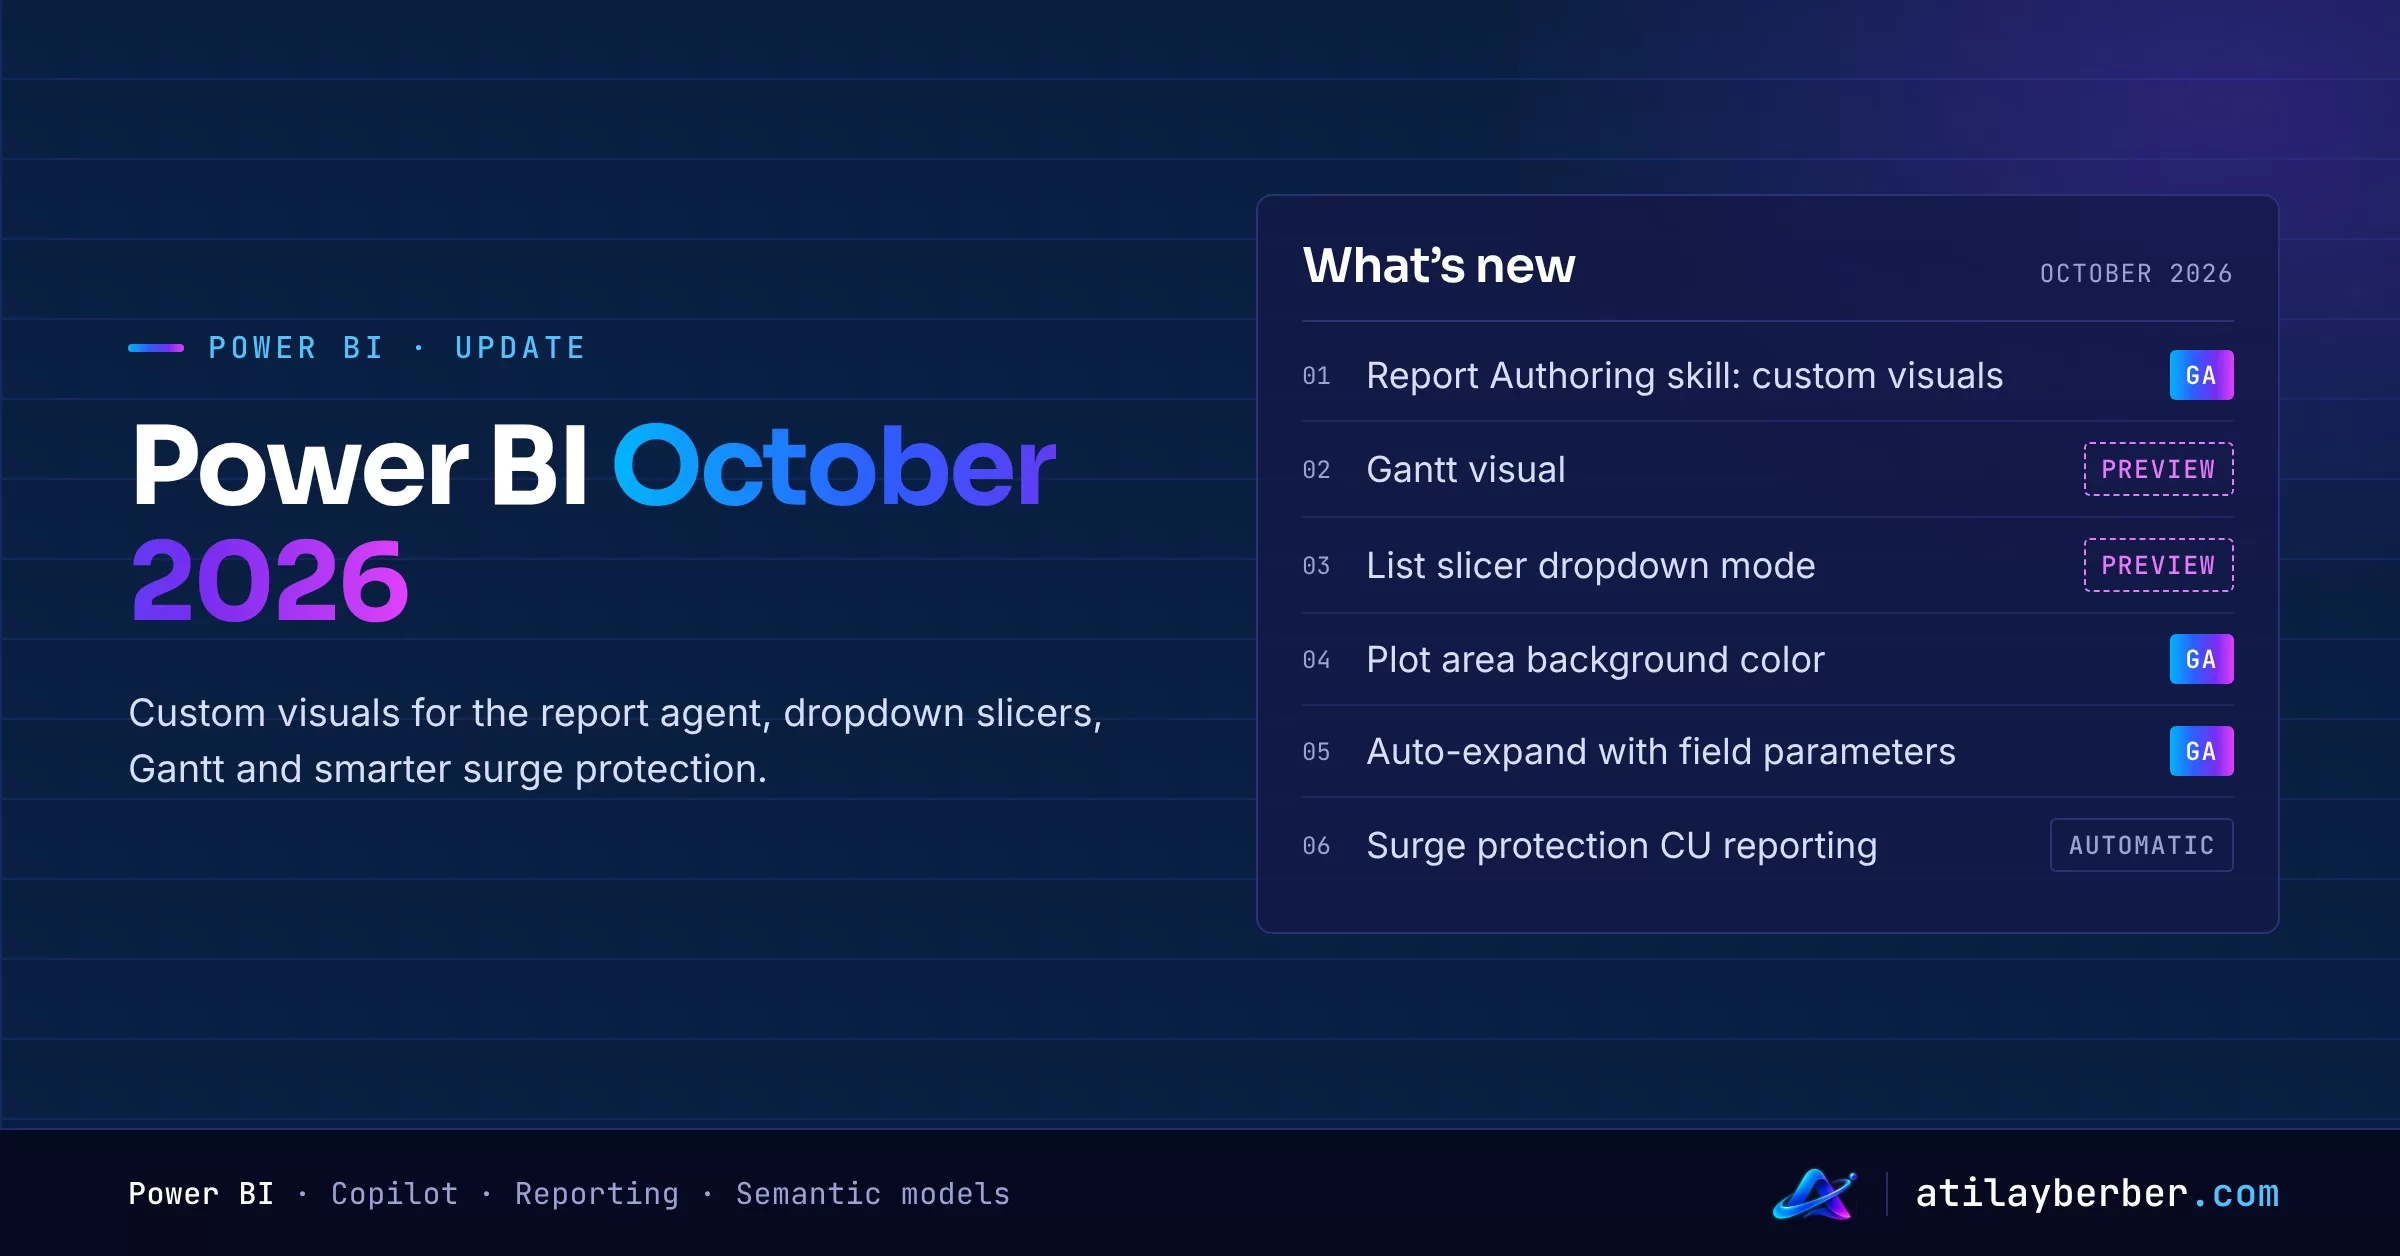
At a glance: what’s in October 2026?
| Feature | Area | Status |
|---|---|---|
| Custom visuals with the Report Authoring skill | Copilot and AI | GA |
| Gantt visual | Reporting | Preview |
| Dropdown mode and “Show selected first” in the list slicer | Reporting | Preview |
| Chart plot area background color | Reporting | GA |
| Auto-expand hierarchy axis with field parameter support | Reporting | GA |
| Personal bookmarks keep column widths | Reporting | GA |
| Continuous CU reporting for surge protection | Semantic models | Automatic |
Copilot and AI
The Report Authoring skill now works with custom visuals (GA)
The Power BI Report Authoring skill is part of the “skills for Fabric” family that lets you build reports in natural language. With October it extends to custom visuals: you can ask the agent to add a visual, bind it to report fields, format it and validate the result.
Two things change in practice:
- Custom visuals already in the report (including ones imported from a file) can be used by the agent. Finding visual identifiers, hand-editing report files and trial-and-error field mapping move to the agent.
- When core visuals aren’t enough, the agent can help you find an AppSource visual that fits the requirement.
My take: if your organization already has an approved list of custom visuals, this saves real time. If it doesn’t, “the agent found a suitable AppSource visual” quickly becomes a governance question. Decide who can use which visuals before you roll this out. I discussed where agents fit into report development in AI Agents Now Build Power BI Reports. Is the BI Developer Next?
Reporting
Gantt visual (preview)
Gantt is now one of Power BI’s core visuals. It shows tasks and progress on a time axis, with milestones, progress formatting, automatic colors by category, extra columns next to the task list and a zoom axis. To try it, enable it in Power BI Desktop under File > Options and settings > Options > Preview features and restart Desktop.
I covered setup, the DAX measures you need and an end-to-end campaign calendar in The Built-in Gantt Visual in Power BI: A Step-by-Step Guide, so I won’t repeat it here.
Dropdown mode in the list slicer (preview)
Good news for anyone working with long lists. The list slicer can now render as a dropdown, and it comes with a few smart behaviors:
- Show selected first: selected values are pinned to the top, so you don’t have to scroll the whole list to see what’s filtered. The button slicer gets this option too.
- Selections as pills: each selection shows up outside the dropdown with its name and a dismiss button, so readers can remove a value with one click. If there isn’t enough room, a “+N” count pill appears.
- “Not (item)” logic: if you use Select all and then clear a few values, the slicer shows that explicitly as an exclusion. If you don’t clear anything, Select all doesn’t filter at all.
- Formatting: the dropdown keeps the formatting of your list slicer items, and you can set the height and width of the drawer and style the search box (background, border, text).
Where does this help? Dimensions with hundreds of values, like stores, products or customers. The old dropdown slicer hid the current selection, which is why users kept asking “why is my report empty?”. The pills mostly solve that.
Plot area background color (GA)
Bar, column, line, area, combo, ribbon, waterfall and scatter charts now support a single fill color and conditional formatting for the plot area. Before, you only had the visual background here.
The conditional formatting part is interesting: bind it to a measure and you could, say, tint the plot area light red for periods below target. Use it sparingly, though. The chart already tells the story; a background color only makes sense as a second signal.
Auto-expand hierarchy axis with field parameters (GA)
When you add more than one column to the axis of a bar, column or line chart, the hierarchy can now expand automatically, matching how auto-expand already works in matrices and slicers. The bigger win is that the hierarchy axis now works with field parameters.
Example: create a “Category” field parameter with Country, Segment and Product. Put it on the axis of a column chart and in a matrix. Pick Country in the slicer and both visuals switch to country. Pick several and the hierarchy expands automatically. One slicer drives the breakdown of both visuals, without rebuilding anything. The same applies when readers change axis fields with Personalize this visual.
Personal bookmarks keep column widths (GA)
Personal bookmarks now save column widths and column order in tables and matrices. Small change, but resizing columns every time you open a report was one of the most common user complaints.
Semantic models
More accurate surge protection
Long-running background operations (a big refresh, for example) now report capacity unit (CU) usage continuously while they run, instead of reporting most of it when they finish. Surge protection gets a more current view of in-progress consumption, so your rejection and recovery thresholds react closer to real usage. No settings to change; it’s automatic.
Microsoft’s measurements from August 2026 show the effect:
| Measurement | Before | After |
|---|---|---|
| Operations rejected proactively by surge protection | 5% | 12% |
| Operations delayed but eventually accepted | 11% | 16% |
| Late-stage Fabric throttling rejections | 23% | 13% |
My take: “more rejections” sounds like bad news, but it’s the opposite. Rejection now happens early, before the capacity is clogged, and the late-stage throttling that slows everything down drops noticeably. If you loosened your surge protection thresholds because they felt too aggressive, this is a good month to revisit them. I explained capacity and throttling in Capacity Management in Fabric and Fabric Throttles, Databricks Bills.
What to do this month
- Update Desktop and turn on the Gantt and list slicer dropdown previews in a test report.
- Move long dropdown slicers to the new mode and switch on “Show selected first”.
- In reports that use field parameters, try auto-expand on column and line charts and connect them to the same slicer as your matrix.
- Review surge protection thresholds together with the Capacity Metrics app.
- If you use the Report Authoring skill, agree on an approved custom visual list first.
Sources
See you next month with the November update. Which of these will you try first? Tell me on LinkedIn.
1 comments