

Author: @atilayberber
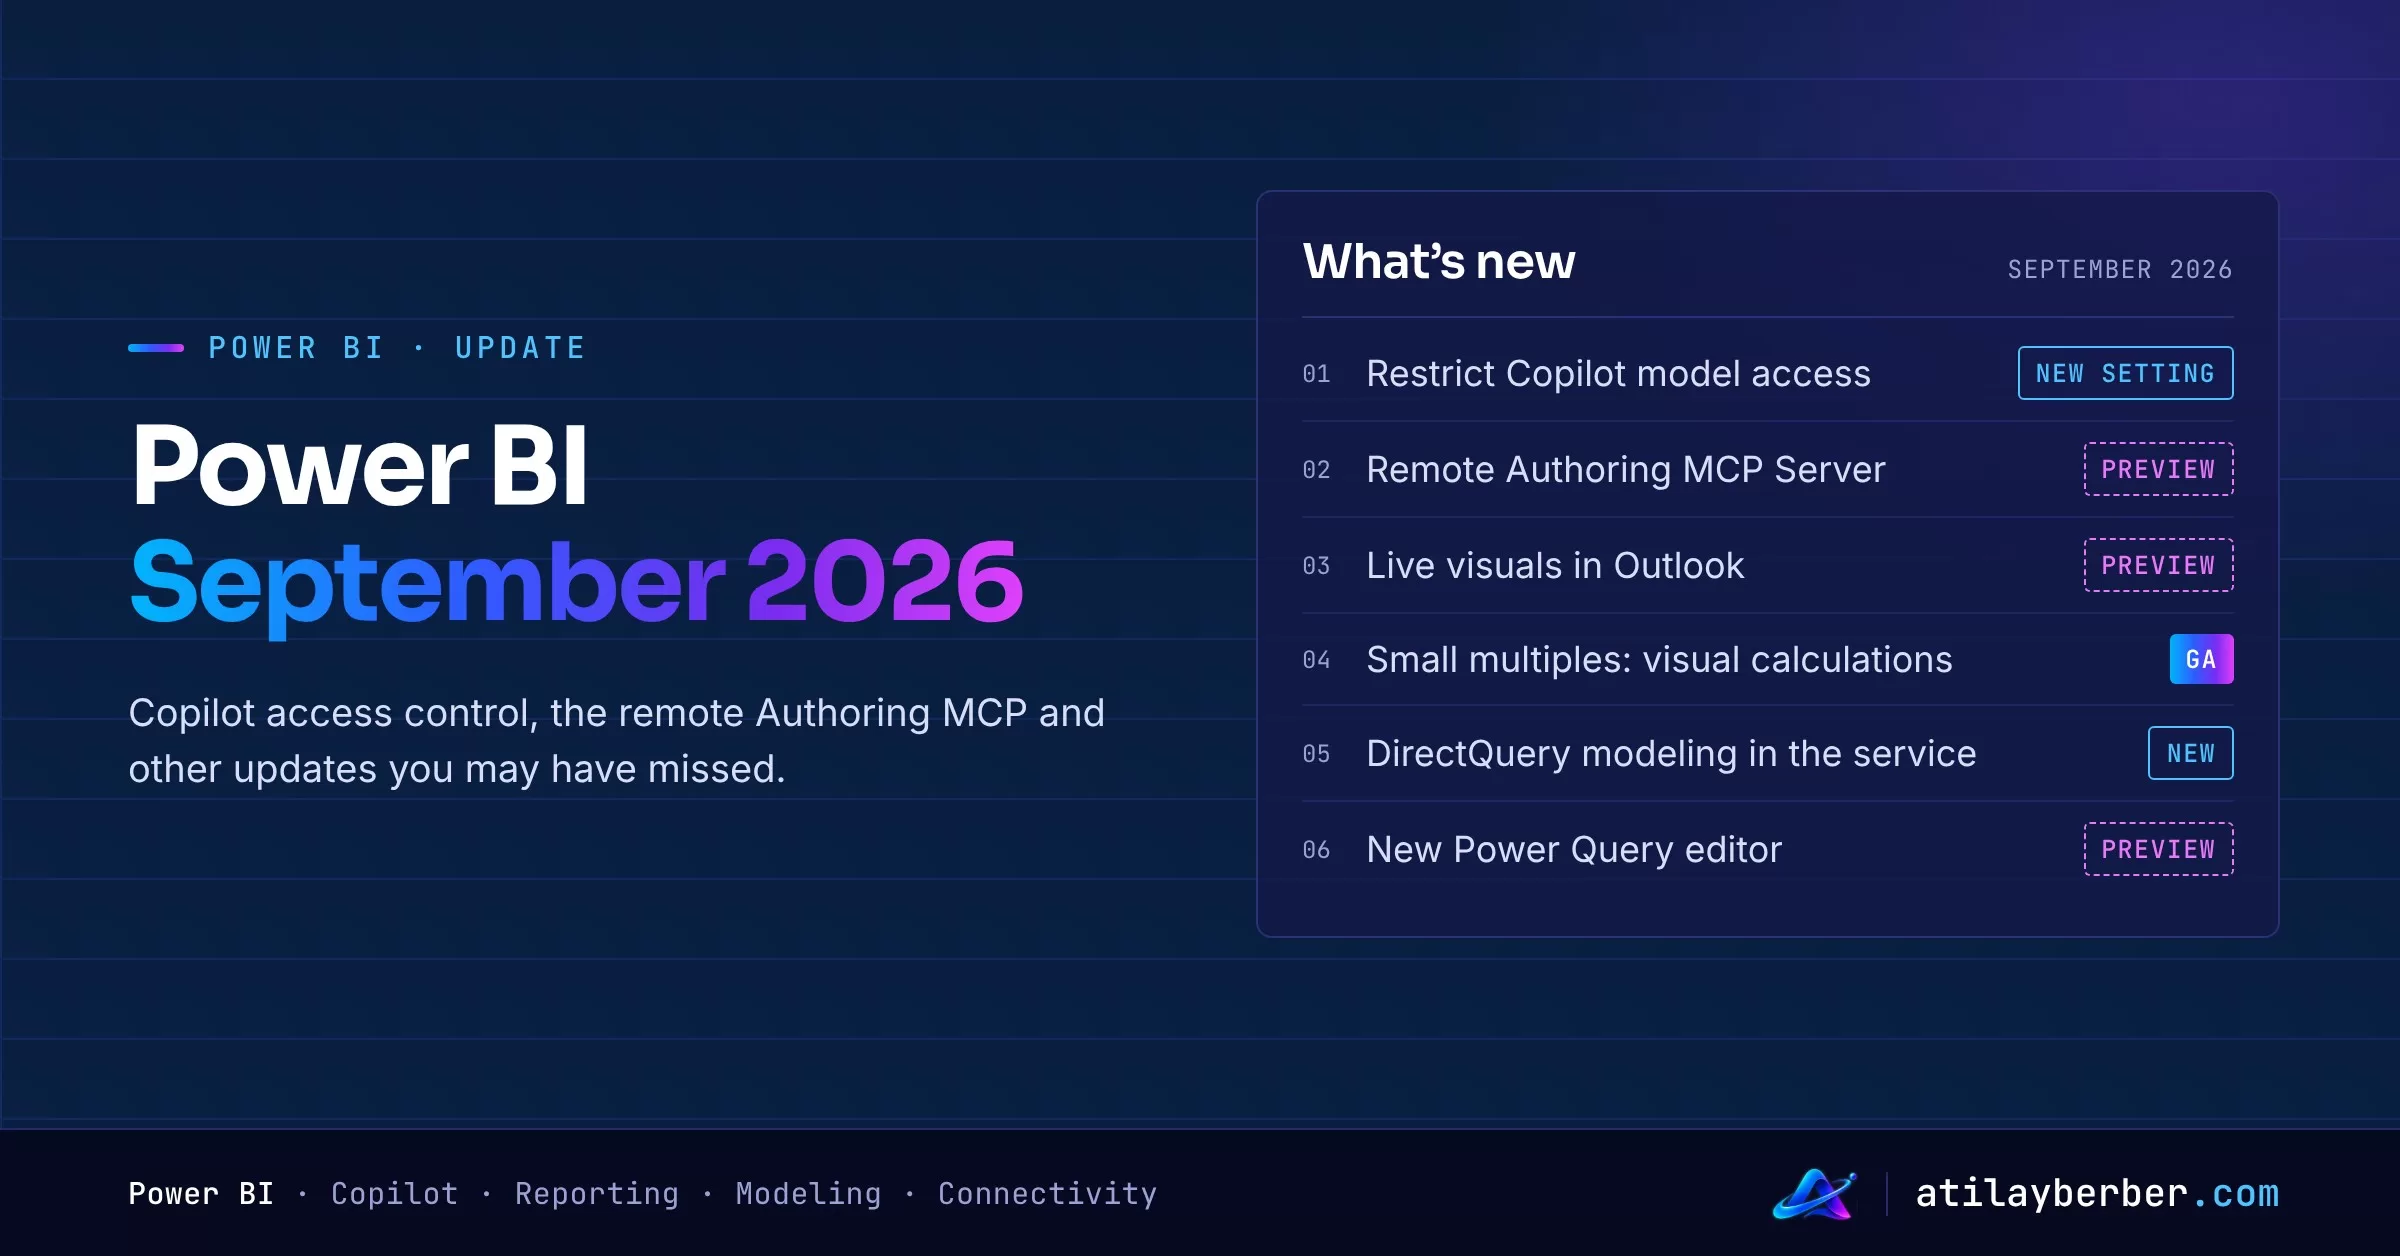
The Power BI September 2026 summary landed in FabCon Europe week, which makes it one of the busiest updates of the year: close to forty items across Copilot and AI, reporting, modeling, data connectivity, mobile and developers. I already published the Power BI October 2026 post in the Monthly Update Notes series; this one fills in the month before.
Some of September’s big headlines already have (or will soon get) their own posts, so I keep those short and spend the space on the updates that got less attention but change day-to-day work.
At a glance: what’s in September 2026?
| Feature | Area | Status |
|---|---|---|
| Setting to restrict Copilot access to semantic models | Copilot and AI | New setting |
| Remote Power BI Authoring MCP Server | Copilot and AI | Preview |
| Fabric IQ-powered Copilot in report viewing | Copilot and AI | New |
| New Report ribbon on the web and Design ribbon | Reporting | Preview / GA |
| Live visual sharing in Outlook | Reporting | Preview |
| Set and reset column widths in tables and matrices | Reporting | GA |
| Visual calculations for small multiples | Reporting | GA |
| Axis initial scroll position, slider colors, sticky format headers | Reporting | GA |
| Value selection replaces Q&A in the Narrative visual | Reporting | New |
| 500,000-row export to Excel | Reporting | Coming soon |
| Create and edit DirectQuery models in the service | Modeling | New |
| New Power Query editor and Outlook Mail connector | Data connectivity | Preview |
| Purge Data option in Fabric APIs | Developers | New |
Quick recap: covered elsewhere
- Power BI Agentic Experiences (GA): in AI Agents Now Build Power BI Reports. Is the BI Developer Next?
- Power BI answers in Copilot Chat and Fabric IQ in Cowork (GA): in Nobody Opens Dashboards Anymore?
- APPROXIMATEDISTINCTCOUNT, string indexing and full-text search (preview), and PBIP going GA: each gets its own detailed post in mid-November.
Copilot and AI
Restricting Copilot access to semantic models
For me, this is the most important governance update of the month. Users with write permission on a semantic model can now block read-only users from reaching the model through Copilot and Microsoft’s remote MCP tools. The setting covers every experience that queries the model: Power BI Copilot, Microsoft 365 Copilot Chat and Cowork, data agents, remote Fabric MCP servers and Power BI MCP servers.
When to use it? When a model isn’t “Copilot-ready” yet: missing measure names and descriptions, several measures for one concept, or sensitive fields not separated. You can keep the report open to viewers while switching off free-form Copilot questions until the model is ready. I explained why that matters in Copilot Won’t Fix Your Bad Data Model.
Remote Power BI Authoring MCP Server (preview)
The Power BI Authoring MCP now also runs as a remote server: AI apps can create and edit semantic models in Fabric workspaces without installing anything locally. That also means Mac users can finally use it. The endpoint for apps like the GitHub Copilot App:
https://api.fabric.microsoft.com/v1/mcp/powerbi/authoringThe local Authoring MCP server stays GA. I covered setup and prompt patterns in my Power BI Authoring MCP Server guide; the remote version works the same way, minus the install step.
Fabric IQ-powered Copilot in report viewing
While viewing a report, you can turn on Fabric IQ from the Copilot pane. Copilot then evaluates the data in the semantic model with a multi-step approach and refines its method as it builds the answer. Expect better answers, with supporting visuals, on complex questions.
Microsoft 365 Copilot is coming to Power BI (preview)
Microsoft wants to replace scattered per-app Copilot experiences with one consistent Copilot. Microsoft 365 Copilot inside Power BI, carrying context and connecting to product-specific capabilities, is in preview. Put it on your watch list; it’s early for production plans.
Reporting
New Report ribbon on the web (preview) and Design ribbon (GA)
Web authoring takes another step toward Desktop. The new Report ribbon organizes commands into tabs and brings features that weren’t on the web before, such as Format Painter.
The Design ribbon puts theme tools in one place: apply a built-in or organizational theme, open the Theme pane, import or download theme files, plus shortcuts to page size, background and wallpaper. Two new built-in themes, Dark and Soft dark, follow Fluent 2 closely.
Live visual sharing in Outlook (preview)
Pasting screenshots into emails may finally be on its way out. In Outlook on the web you can insert a Power BI visual into an email and share it live and interactive. Recipients view and interact with it without leaving Outlook. The weekly “sales summary” email is the obvious first candidate.
Set and reset column widths (GA)
Report readers can right-click a column header in a table or matrix, choose Set column width and enter a width in pixels; Reset column width goes back to the author’s setting. Changes last for the session only and don’t affect other viewers. Pair it with October’s “personal bookmarks keep column widths”: readers set the width, then save it in a bookmark.
Visual calculations for small multiples (GA)
You can now write visual calculations in visuals that use small multiples, for example a moving average on a line chart split by country, without adding a measure to the model. In the visual matrix, the small multiples field shows up on the ROWPAGES axis; choose ROWPAGES alone or with ROWS and COLUMNS to control how the calculation moves through the visual.
Small GAs you’ll like
- Axis initial scroll position: when a categorical axis shows a scrollbar, set “Initial scroll position = End” in the Layout section and the visual opens on the most recent data. No more readers landing on 2019 first in monthly trends.
- Slicer slider colors: in Between, Before, After and Date picker modes you can style the handles and color the handles, selected range and track.
- Sticky format pane headers: section headers stay at the top while you scroll through long sections.
- Power BI Home: Data Refreshed and Modified Date columns and customizable list views.
Value selection replaces Q&A in the Narrative visual
With Q&A retiring, dynamic values in the Narrative visual and text box are now built through a deterministic UI instead of natural language: pick a column or measure, apply a summarization and add filters. Values created with Q&A stay as read-only. I flagged Q&A’s December 2026 retirement in my Copilot Chat post; list the reports that use Narrative visuals.
500,000-row Excel export (coming soon) and subscription emails
- Exporting table visuals to Excel with Data with current layout goes from 150,000 to 500,000 rows.
- Subscription emails are moving to a new delivery platform. Sender identity and formatting may change; subscriptions move automatically and don’t need to be recreated. If mail rules or filters in your organization key on the sender address, give IT a heads-up.
Modeling
Create and edit DirectQuery models in the service
DirectQuery semantic models can now be created and edited directly in the Power BI service, in the browser. No download-edit-republish loop; Mac and Linux users can author models, and several people can work on the same model at the same time. For small models over real-time sources, the dependency on Desktop goes away.
Data connectivity
- New Power Query editor (preview): after the modern Get Data experience that’s been in preview since May, the whole editor gets a refresh. Same engine, new editing surface. It’s a preview, so the remaining gaps with the legacy editor are still being closed.
- Microsoft Outlook Mail connector (preview): built on Microsoft Graph, it reads folders, messages and attachments from your mailbox with an organizational account. It’s the first of the modern alternatives to the Exchange Online connector. For now it’s Desktop only and doesn’t support scheduled refresh.
- Data Privacy Firewall: common patterns where one query returns a value that another uses to build a web request, SQL statement or file path now run without refactoring, as long as privacy levels are compatible (a preview that’s been on by default since July).
Developers and mobile
- Purge Data in Fabric APIs: in programmatic semantic model deployments, you can explicitly approve changes that require removing existing data, such as schema or data type changes. Data protection stays on by default.
- Mobile: the page indicator and contact details in the Info drawer are GA.
- Desktop file picker: Desktop versions from March 2026 or earlier can no longer save and share to OneDrive and SharePoint as of October. Make sure no old versions are left in your organization.
What to do this month
- Review the models you’ve opened to Copilot; for those that aren’t ready, switch off Copilot access for read-only users.
- If teammates use a Mac, try the remote Authoring MCP endpoint.
- List Narrative values created with Q&A and move them to the new value selection.
- In trend charts, set “Initial scroll position = End”.
- Update old Desktop versions, and revisit big exports once the 500,000-row Excel limit arrives.
Sources
The next Power BI post in this series comes with the November update. Which of these matters most to you? Tell me on LinkedIn.